NIH Weekly Report — Jun 22, 2026
Grant Witness · June 22, 2026
This Week’s Snapshot
Grant Witness has picked up on the following changes to the NIH grants, since the last report published:
- Disrupted (terminated, frozen, and non-renewals): 0
- Restored (reinstated, unfrozen, renewed after a delay): 0
If you want to compare the reported disruptions to cumulative weekly trends, Table 1 provides more context on which NIH grants have been terminated and reinstated since Feb 3, 2025.
With this week’s disruptions, the following is the total lost funding for NIH grants, based on the latest obligation data available from Apr 30, 2026: $532.81 Million
The states with the largest disruption of NIH grants are: New York, California, and Massachusetts
If you want to explore this topic further, Table 2 breaks down terminated, reinstated, and lost funding for NIH grants by state, specifically affected on and before Jun 22, 2026.
Additionally, for a breakdown of NIH grant disruptions across institutions, see Table 4, Table 5, and Table 6, which list the number of grants that were ever disrupted, are currently terminated, and are currently reinstated across grant recipients, respectively.
Weekly Terminations vs Reinstatements
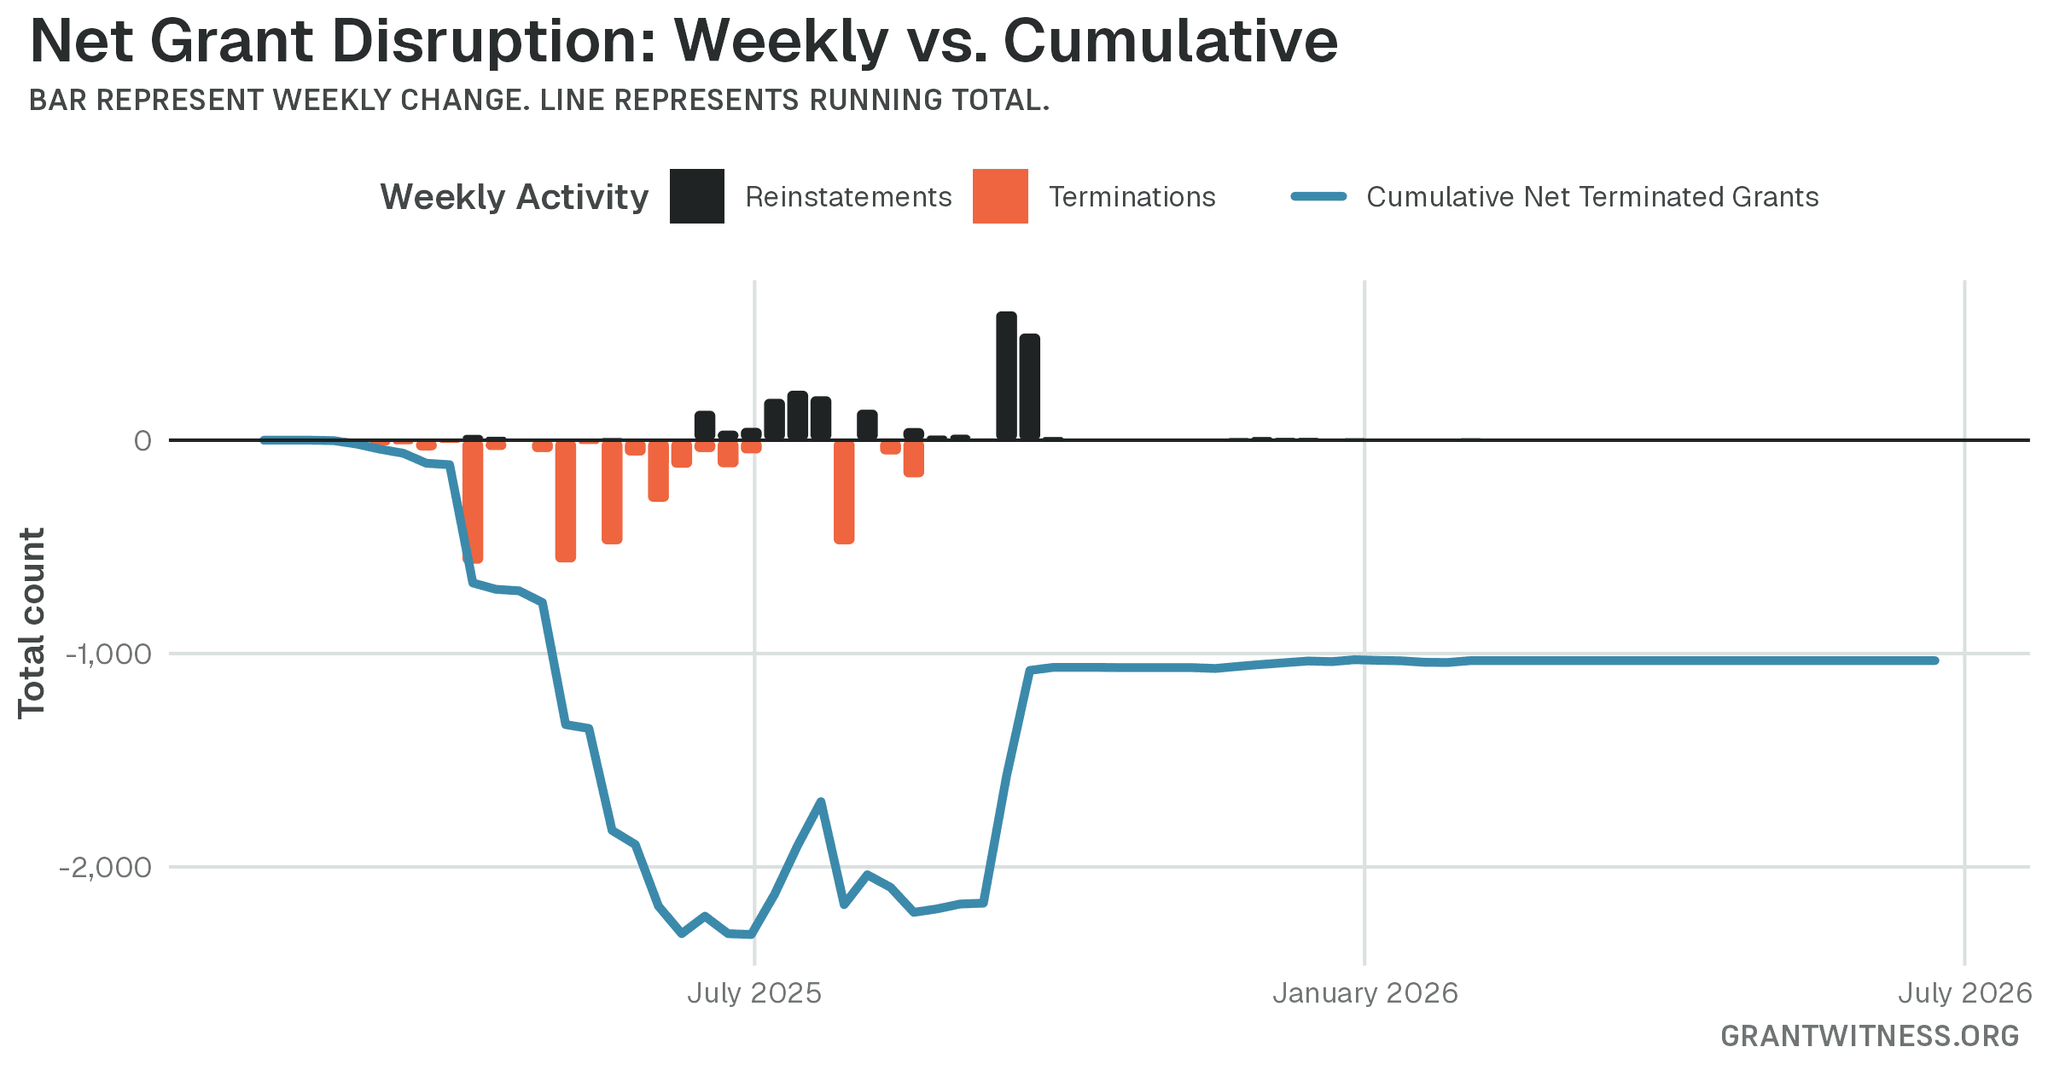
The following visualization shows the weekly number of terminated and reinstated grants since Feb 3, 2025. For more information about how the statuses “termination” and “reinstatement” are determined along with their dates, see our methods.
To calculate the weekly change in grant disruptions, we calculate the total number of reinstatements (+) for that week and subtract the total number of terminations (-) from it.
The cumulative net terminated grants, which represents how many grants have been terminated since Feb 3, 2025, is calculated as the sum of the weekly changes. When this value is equal to zero that means all terminated grants have been reinstated.
Grants by State
- Total disruption includes all grants that have been ever terminated. Even if a grant is currently reinstated, it is included in this total, since the grant had been previously terminated.
- Currently terminated grants exclude any grants that have been reinstated.
- Currently reinstated grants exclude any grants that have been terminated.
- “Lost funding” is the amount of funding awarded to grants that was not paid out because of terminations, excluding reinstated grants.
Grants by Type
In this report, we distinguish between the following grant types:
- R Series: These grants fund independent research projects led by a principal investigator. These are the most common types of NIH grants. Funding goes towards research aims rather than training or career development.
- T Series: These grants go to institutions to support training programs for undergraduate, graduate, and postdoctoral researchers. A single T grant will support multiple trainees. These grants fund stipends, tuition, and training activities (e.g. courses, workshops, conferences).
- Individual Training / Fellowships (F Series): These are research training grants for individuals, rather than institutions. The goal of these grants is to help predoctoral and postdoctoral trainees gain skills needed for a successful research career.
- Early Career (K Series): These are grants for individual researchers (usually postdocs or early-career faculty) to help them become independent scientists. They provide salary support and research funding.
The table below lists the number of currently terminated grants for each grant type from every state.
Grants by Recipients
Each table below lists the top 50 institutions. The export buttons cover only what is in the table — to work with every affected grant, download the full data for this report (CSV).
All Disruptions
The following table is ordered by which institutions had the most number of disrupted grants, which includes grants that are currently reinstated, since at one point that grant had been terminated.
Current Terminations
The following table is ordered by which institutions, as of Jun 22, 2026, currently have the most number of terminated grants.
Current Reinstatements
The following table is ordered by which institutions, as of Jun 22, 2026, currently have the most number of reinstated grants.